

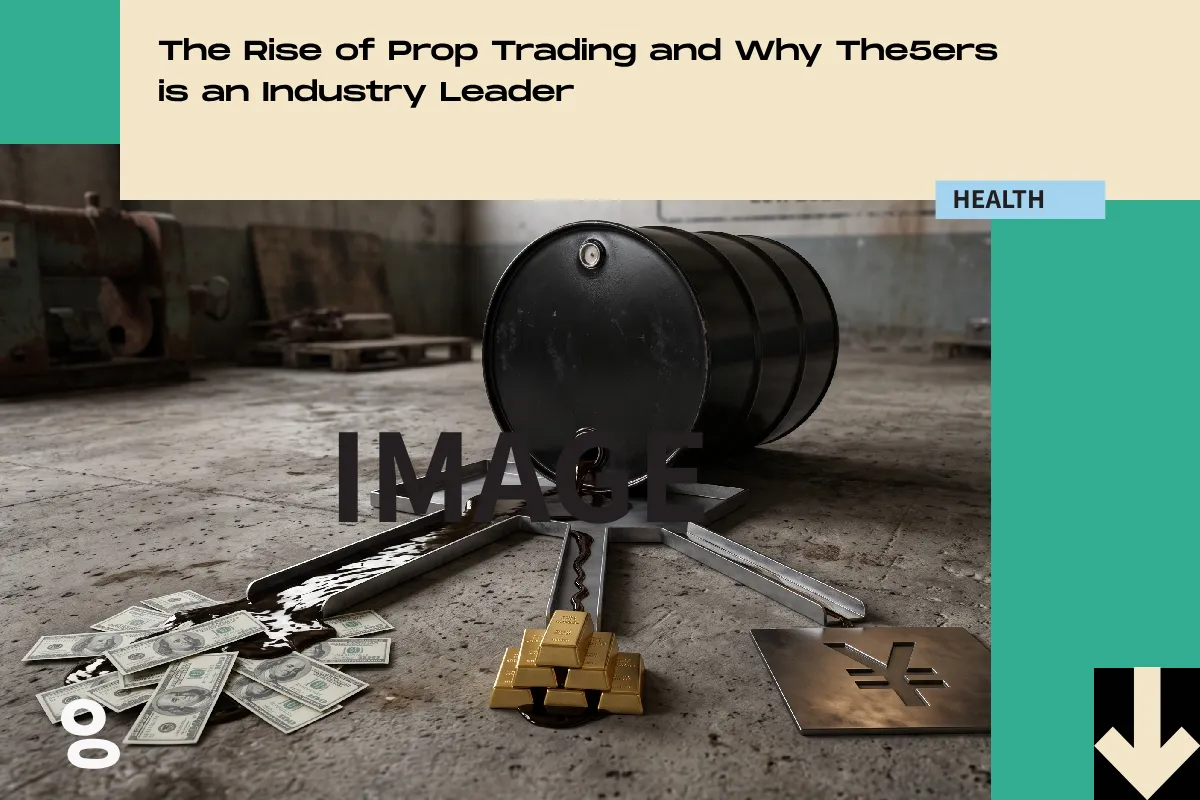

Every few years, the internet declares the petrodollar system dead. In June 2024, a viral post claimed a 50-year US-Saudi “petrodollar agreement” had just expired, sending search interest to record highs. The story was false, but the panic pointed at something real: the petrodollar system is under its first genuine structural pressure in decades. Understanding what the petrodollar system actually is, and what is eroding it, matters for anyone building a trading strategy — whether that runs through forex, futures, equities, or crypto.
- The Petrodollar Myth vs. the Real US-Saudi Agreement
- Dollar Reserve Currency Status: The Data Behind De-Dollarization
- Who Is Abandoning the Dollar and Why It Matters for Traders
- Why Oil Still Underpins the Global Dollar System
- China’s Clean Energy Boom and the Threat to Petrodollar Demand
- Gulf Sovereign Wealth Funds: Diversifying Away from the Dollar
- mBridge vs. SWIFT: The New Battle Over Dollar Settlement
- Why the Petrodollar System Won’t Collapse Overnight
- Petrodollar System Outlook: What to Watch in 2026–2027
This is not an abstract macro debate. The rebalancing is already visible as tradable price action across every venue: in the dollar index and the major FX pairs, in gold and energy futures, in gold-mining, energy, and defense equities, and in the dollar-pegged stablecoins that anchor most of crypto. Which of those moves you can actually act on comes down to your broker or funded account. This breakdown separates the myth from the mechanics, then maps where each shift shows up for traders.
Here’s What This Breakdown Covers:
- The real 1974 US-Saudi deal versus the viral myth
- What shrinking dollar reserves mean for gold across futures, equities, and crypto
- Who is hedging away from the dollar, and where it prints in FX
- Why oil settlement still anchors the dollar, and the energy contracts that track it
- How China’s clean-energy lead and Gulf equity buying reprice sectors
- The mBridge–SWIFT settlement fight and its crypto and payments read-through
- What to watch through 2026–2027, and how to position through a broker or funded account
The Petrodollar Myth vs. the Real US-Saudi Agreement
The popular version of this story gets the history wrong. In August 1971, Nixon closed the gold window, ending Bretton Woods convertibility. In July 1974, Treasury Secretary William Simon flew to Saudi Arabia and secured a real but narrower deal: Riyadh would recycle its oil surpluses into US Treasuries in exchange for military protection. Bloomberg confirmed the arrangement’s details only in 2016, through a FOIA request.
What never existed was a formal clause requiring Saudi Arabia to price oil exclusively in dollars. A 1979 GAO review found no such provision, and the kingdom still accepted sterling into 1974. As historian David Wight notes, the dollar’s dominance is why oil sells in dollars, not the other way around.
Petrodollar Claims: Fact vs Myth
| Claim | Status |
|---|---|
| Nixon ended gold convertibility, 1971 | True |
| Simon’s 1974 Saudi mission (Treasury-for-security) | True |
| Secret Saudi Treasury recycling, confirmed 2016 | True |
| Formal “oil priced in dollars” treaty | Myth — no such clause found |
| 50-year deal “expired” June 2024 | False, debunked |
Takeaway: The petrodollar system was never a contract; it is a web of incentives. It cannot expire on a date, but it can erode as those incentives shift — which is exactly the slow-burn risk that long-term FX, rates, and futures positions need to price in, rather than a single headline to trade around.
Dollar Reserve Currency Status: The Data Behind De-Dollarization
The dollar’s share of allocated global reserves stood at 56.77% at end-2025, down from ~71% around 2000. The IMF attributes much of that decline to valuation effects rather than active selling, and a Fed analysis found the share broadly stable from 2022 to 2024.
Dollar and Gold Reserve Indicators
| Metric | Reading |
|---|---|
| Share of allocated FX reserves | ~56.8% |
| Share of global export invoicing | ~54% |
| Share of FX transactions | ~88% |
| Renminbi share of reserves | ~2.1% |
| Gold share of official reserves | >23% |
The sharper shift is gold. Central banks have bought ~1,000 tonnes a year since 2022, double the previous decade’s pace, and gold’s reserve share has more than doubled since 2015, helped by a record $5,589/oz print in January 2026. In the World Gold Council’s 2026 survey, 74% of reserve managers expected the dollar’s share to fall over five years, with gold — not the euro or the yuan — absorbing most of the difference.
For traders, that single theme radiates across four niches at once. In futures, it underwrites a structural bid for COMEX gold (GC) and keeps the forward curve firm. In equities, it has powered gold-mining and royalty names, which tend to leverage bullion’s move rather than merely track it. In forex, persistent official buying is a slow headwind for the dollar index (DXY). And in crypto, the same debasement-hedge logic feeds Bitcoin’s digital-gold narrative, even though central banks themselves stick to metal.
Takeaway: De-dollarization is real but slow, and it is flowing into gold rather than a rival currency. Whether you express that through GC futures, mining equities, a short-DXY lean, or a BTC allocation, the thesis is the same — and it belongs in any prop firm trader’s macro playbook.
🔗 Gold Futures
Who Is Abandoning the Dollar and Why It Matters for Traders
Washington’s use of sanctions and asset freezes has taught reserve holders that dollar assets carry policy risk. Each participant now runs its own calculus on whether to stay inside the petrodollar system or hedge away from it.
How Each Bloc Approaches the Dollar
| Entity | Historical gains | Current anxiety | Direction |
|---|---|---|---|
| United States | Cheap deficit financing | Sanction overuse eroding appeal | Defending the system |
| GCC states | Security guarantees | Freeze risk | Multipolar hedging |
| China | Export-led dollar demand | Asset-freeze vulnerability | Yuan internationalization |
| Global South | Standardized trade rails | Dollar debt crises | Local-currency settlement |
Each row eventually prints somewhere a trader can see. Yuan internationalization surfaces in USD/CNH and offshore-yuan flows; local-currency settlement across the Global South pressures emerging-market pairs; and the GCC’s multipolar hedging feeds the equity and payments shifts covered below.
Economist Brad Setser (CFR) offers a useful counterpoint: the petrodollar’s glory days ended long ago. The US is now a net oil exporter, and global dollar liquidity owes more to Asian manufacturing surpluses than to Gulf oil money. On this view, oil pricing was always less decisive than the sheer depth of dollar markets — a caution against overtrading any single currency headline as a catalyst.
🔗 Forex Pairs
Why Oil Still Underpins the Global Dollar System
OPEC holds ~80% of proven crude reserves; with OPEC+ partners such as Russia, that reaches ~88%. In 2025, OPEC exported 19.85 million barrels a day, with nearly 75% flowing to Asia. The US produces the most crude of any single country but exports only ~30% of its output.
That crude also feeds plastics, fibers, and pharmaceutical inputs — many active drug ingredients derive from benzene and ethylene chemistry. When banking sanctions froze payment channels, Iranian hospitals documented chemotherapy shortages. Control of oil-dollar settlement is control of a supply chain that reaches the pharmacy shelf.
This is where the futures niche sits closest to the story. The benchmark contracts — WTI (CL) and Brent — are quoted and margined in dollars, so oil-dollar settlement is not abstract; it is embedded in the curve. The Brent–WTI spread, and whether the curve sits in backwardation or contango, tells you how tight physical barrels are right now versus later, and calendar spreads let traders express that timing view directly. Energy equities — majors, refiners, and chemical producers — re-rate on the same cycle, while oil-linked currencies like the Canadian dollar (CAD) and Norwegian krone (NOK) give forex traders a cleaner, more liquid way to hold the same idea.
Takeaway: Whoever settles the oil trade settles the feedstock of the industrial and medical economy — the real prize behind the currency contest. It is a theme worth tracking whether you trade CL and Brent directly, the energy equities that ride them, or the commodity-linked FX pairs that shadow the price.
🔗 Oil Futures
China’s Clean Energy Boom and the Threat to Petrodollar Demand
The more serious threat to the petrodollar system isn’t a rival currency; it’s a world that needs less oil — and China is building it. Chinese firms now file ~75% of global clean-energy patents (up from 5% in 2000), including ~90% in solar and wind and ~85% in storage. China invested $625 billion in clean energy in 2024, about 31% of the global $2,033 billion total.
China’s Clean-Energy Patent and Investment Lead
| Metric | China | US + EU |
|---|---|---|
| Clean-energy patents | ~75% | Minor |
| Solar/wind patents | ~90% | Low |
| Storage patents | ~85% | Low |
| 2024 clean-energy investment | $625bn | $835bn combined |
World Bank research notes that Chinese patents are filed overwhelmingly at home, with little international co-invention, and that quality still lags on high-value triadic patents. But the direction is unambiguous: every panel and battery China exports shrinks the future oil trade that dollar recycling was built on.
For stock traders, that shows up as a widening performance gap between legacy energy majors and the clean-tech supply chain — a genuine sector-rotation story, not just a patent statistic. For futures traders, the same transition is repricing the industrial metals behind it, with copper (HG) and battery inputs like lithium bid as electrification demand competes with the crude complex.
🔗Energy Stocks
Gulf Sovereign Wealth Funds: Diversifying Away from the Dollar
Gulf sovereign wealth funds now manage ~$4.9 trillion, roughly 40% of global sovereign fund assets, and are projected toward $7 trillion by 2030. Six of the world’s ten largest funds sit in the region, increasingly acting as strategic, demand-driven investors in technology and infrastructure rather than passive bond buyers.
Saudi Arabia’s Vision 2030 is shifting from a domestic “Big Push” to a disciplined “Long Push” built on income-generating foreign assets, anchored by the ~$1 trillion Public Investment Fund, with annual deployments signaled toward $70 billion. The security guarantee behind the original 1974 arrangement still ties defense names to the same calculus, part of why that sector has carried a persistent geopolitical premium.
Takeaway: The recycling loop that once fed US Treasuries now feeds diversification. The dollars still flow; the destination is changing — from the bond desk’s auction demand to visible equity ownership in technology, infrastructure, and defense that stock traders can track directly.
mBridge vs. SWIFT: The New Battle Over Dollar Settlement
Project mBridge, a multi-CBDC cross-border settlement platform, reached MVP stage in June 2024, with Saudi Arabia joining as a full participant. In October 2024, the BIS exited the project, handing it to China, Hong Kong, Thailand, the UAE, and Saudi Arabia — following BRICS talk of a rival “BRICS Bridge” that BIS chief Agustín Carstens said could not include sanctioned states.
mBridge has since processed ~$55.5 billion across 4,000-plus transactions, ~95% settled in digital yuan — effectively a renminbi rail for China-Gulf trade that bypasses correspondent banking, the very layer through which Western sanctions operate. The BIS, meanwhile, launched Project Agorá with G7-aligned banks and SWIFT, with findings due in H1 2026.
mBridge vs Project Agorá
| Feature | mBridge | Project Agorá |
|---|---|---|
| Core members | China, HK, Thailand, UAE, Saudi Arabia | US, Eurozone, Japan, UK-aligned |
| BIS role | Exited Oct 2024 | Founding coordinator |
| Dominant currency | Digital yuan (~95%) | Dollar-centric |
| SWIFT | Bypassed | Named participant |
| Volume | ~$55.5bn | Testing phase |
This is the section where the crypto niche stops being a metaphor. mBridge and Agorá are, at heart, wholesale central-bank digital currency (CBDC) experiments — state-run answers to the same settlement problem that crypto rails were built to solve. The near-term market read is less about tokens than about plumbing: dollar-pegged stablecoins still dominate crypto settlement, so a credible non-dollar rail is a slow structural challenge to that dominance — and a direct one to the correspondent-banking revenue that Western banks and brokers still sit on.
🔗 CBDCs and Stablecoins
Why the Petrodollar System Won’t Collapse Overnight
- Network effects endure — the dollar still touches 88% of FX transactions, the base layer under nearly every forex book.
- No ready successor — the yuan is 2.1% of reserves, and capital controls cap its appeal.
- Scale gap — mBridge’s $55.5bn is a rounding error next to daily dollar-rail volume.
- Valuation math — much of the reserve-share decline is exchange-rate driven, not active selling.
- USD-denominated plumbing — futures margin, commodity settlement, and the vast majority of stablecoins are still priced in dollars.
- US countermeasures — Washington has threatened tariffs on BRICS currency initiatives.
- Shock reflexes — the early-2026 Gulf conflict and Hormuz disruption, before the mid-year ceasefire, still sent capital toward dollar markets, not away from them.
Petrodollar System Outlook: What to Watch in 2026–2027
The petrodollar system won’t die on a date; it was never a contract that could expire. But the incentives underneath it are visibly shifting — gold over Treasuries, yuan rails for Gulf-China trade, clean-tech over crude dependence, and sovereign funds that invest rather than park.
The realistic outcome is coexistence, not collapse. Watch four numbers through 2026 and 2027: the dollar’s COFER reserve share, central-bank gold tonnage, mBridge settlement volume, and the currency mix of Gulf oil invoices. Each carries a direct read-through for traders — into DXY and pairs like GBP/USD and USD/CNH, into GC and energy futures, into gold-mining, energy, and defense equities, and into crypto’s dollar-stablecoin base.
For anyone looking to turn that macro picture into real positions, those four indicators — not viral expiry dates — are what will move currencies, metals, energy, and equities over the next two years. The instrument you choose, and the broker or funded account behind it, simply decides how you take the trade.
🔗 Funded Trading Account
NFA. DYOR. This analysis is for informational purposes only and is not investment advice. Sources: IMF COFER, Federal Reserve, BIS, CFR, Ember, IRENA, OPEC, World Gold Council, Bloomberg, Stanford Center for Sustainable Development.